So Far There’s No Middle Ground
Running The Worst Election Ever has been a fun experience so far, it gave us a chance to build the type of project that we don’t normally create and experiment with new styles of marketing. I’m especially excited to roll out our next round of updates, we’ll be able to poll for more focused data around each debate.
One of the biggest challenges we faced was sourcing content for our comparisons. Ahead of the debates neither of the two candidates had voiced any substantive policy, but we needed to pull in something. We combed the web for stories about each candidate and found that during such a divided election it took ages to come up with a group of comparisons that didn’t lean too far either way. Now that the candidates have had their first debate we’ve actually got some apples-to-apples comparisons, but I thought it would be fun to take a look at how the voting has broken down so far.
I was happy to see that more than half of the people who voted completed all 15 comparisons, that was a surprise as I felt that making 15 choices took a little too long. I was even more surprised to see that most people voted either entirely for Hillary Clinton or Donald Trump, as I went through the quiz there were times I voted for either candidate and times that I had a hard time choosing.
This is the breakdown of voters by percentage of votes for each candidate, notice the tall spikes on the left and right, those are voters that cast all 15 votes for Hillary (blue) and Donald (red).
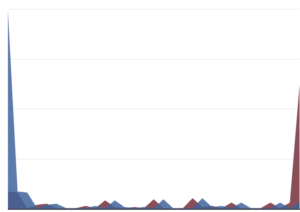
I knew that this was a divided election, but couldn’t believe how few voters had a mix of votes across a broad range of topics. It seems that there really is no middle ground!
As we get closer to the election I’m going to be looking at more ways to analyze the data and pay attention to the trends, in the mean time take a look at the leaderboard to see who is The Worst.